Mapping Mitochondria in the Brain
In a new paper in Nature, the laboratory of Martin Picard, PhD, mapped the location and activity of the many mitochondria in a human brain.1, 2 Dr. Picard is associate professor of behavioral medicine at Columbia University Irving Medical Center and directs the Mitochondrial Psychobiology Group. This project was conducted in collaboration with Michel Thiebaut de Shottten, PhD, at Director of research the CNRS in Bordeaux,
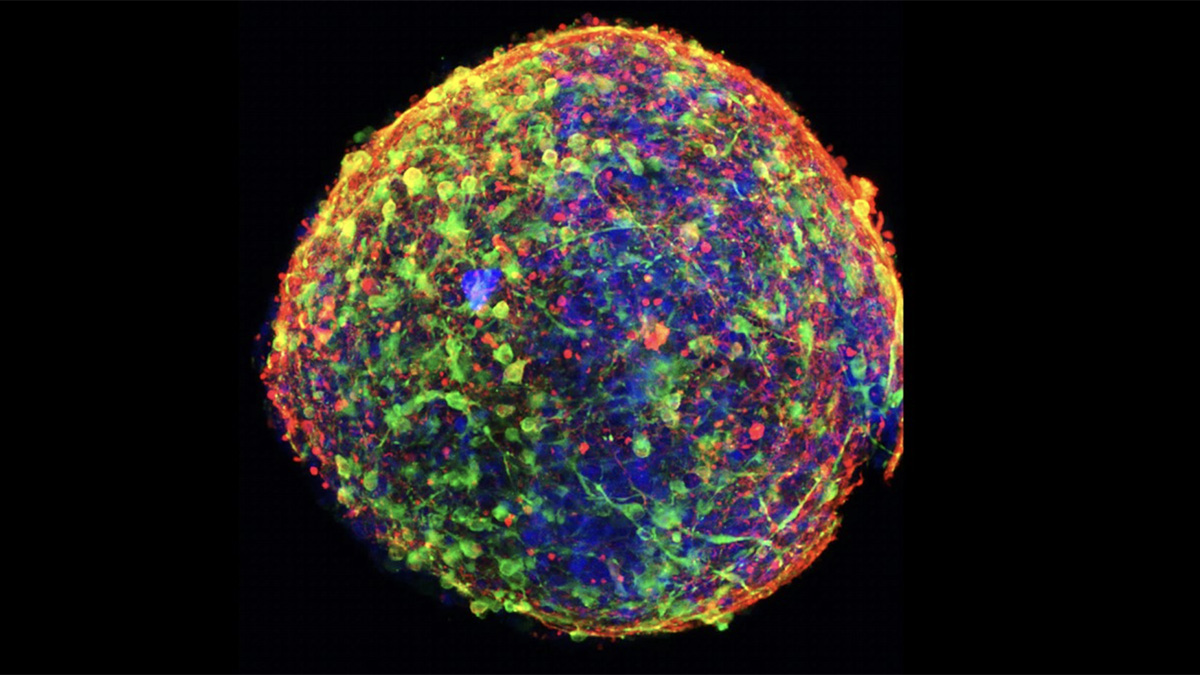
When most of us think about burning energy, we think of exercising our muscles. However, small as it is, the brain consumes an outsized proportion of our energy. It needs that energy to perform its myriad functions, and to provide all that energy, each brain cell contains thousands of mitochondria, the organelles that produce energy.
Dr. Picard wondered how the many mitochondria are located in the brain and how they relate to energy production and usage in different areas of the brain. How are the cellular components associated with brain anatomical structures? To explore these and other questions, they developed MitoBrainMap v1.0.3
They began by developing a method to physically divide or “voxelize” a frozen human brain into small cubes or voxels (3x3x3mm). Interestingly, magnetic resonance imaging (MRI) images small cubes of brain, virtually “voxelizing” the brain, but the voxelization of the brain into physical cubes had to await the development of new methods. This was spearheaded by Eugene Mosharov, PhD, first author on the paper.
Next the team had to define the different mitochondrial types across the brain. They found that the different regions of the gray and white matter had quite different mitochondrial densities and activities (measured as oxidative phosphorylation activity). Intriguingly, there was an intriguing correlation: regions with higher activity were those that developed later in evolution.
The final challenge was to create a computational model to assemble the information from a single slice to the whole brain. This was accomplished by Michel Thiebaut de Shotten, PhD, a neuroanatomist from the CNRS in Bordeaux. The team then expanded that model into a prediction model that allowed them to assign predictions to other regions of the brain, based on date from MRIs.
The map is only the beginning. The team can now use that map to further explore the relationship of mitochondria in different regions of the brain with psychosocial and cognitive factors; exploring the mind-mitochondria connection. This new tool will enable them to study how brain energy relates to anatomy, development, behavior, and neurodegeneration, and the nature of the mind and consciousness.
“This is the kind of project that is nearly impossible to do” said Picard, “we had to find an exceptionally high-quality brain, align engineering, computational, molecular biology, and neuroscience expertise, and find the right students courageous enough to undertake this massive effort! I am so grateful for this amazing team that came together to create MitoBrainMap v1.0.”
A Conversation with Martin Picard
How did the idea come about to create the mitochondria brain map?
One November evening in the lab, after discovering the diversity of mitochondria in the mouse brain (Nature Communications 2023) and imaging the brain of our patients with rare mitochondrial diseases. I dreamed of a way to systematically map mitochondria across the whole brain. Chatting with my engineer-at-heart neuroscientist colleague Eugene Mosharov, we came up with the technical approach to turn the brain into cubes to create the MitoBrainMap v1.0.
What were the steps needed to get the data?
1. Find a brain, 2. Develop a hardware/software approach to physically partition, or voxelize the brain, 3. Perform >18,000 laboratory assays, 4. Visualize the massive multi-modal dataset in the brain space, 5. Register that data to the standard human brain space used in neuroscience with Michel Thiebaut de Shotten.
Were there many debates and questions about how to get the right sample sizes and make sure they were representative?
We initially wanted to do the whole brain, but estimated that this would cost >5 million dollars and take multiple years. We abandoned that ambition, and focused on a single section of a single brain hemisphere.
What problems did you have to overcome?
The major challenge was one of scale. This was by far our largest mitochondrial phenotyping project. We developed a higher throughput lab platform and a robust data processing pipeline to overcome this challenge. The other challenge was the working across disciplines, combining molecular and single-cell RNA sequencing, mitochondrial biochemistry, neuroscience, and neuroanatomy.
How did the team work together?
Cohesive teamwork was critical. Students generated a ton of data. Eugene handled and integrated the unique dataset. Orian Shirihai’s team validated and enhanced our mitochondrial assays. And Michel Thiebaut de Shotten mapped this data onto the brain, developing an algorithm to extend to the whole brain.
How long did it take from inception to final paper?
November 2020 to March 2024 – 3.5 years! Plus a year to revise the paper.
What are the next steps on your research?
Cynthia Liu in our lab is now measuring mitochondrial content and OxPhos enzyme activities in 5,000 human samples. This will validate and extend this line of work.
Was there any correlation between mitochondria and regions of known brain functions (e.g., speech, vision, hearing)?
Great question. This is something to explore in future research.
The gap between molecular processes and macro-imaging often contains fascinating information. Your work bridged that gap. Might there be other organelle targets of your work?
Mitochondria are pretty special. They have their own genome, two membranes, and without them, mammalian cells cannot live at all. All cellular and molecular processes converge on their requirements for energy, and the human genome is actively regulated by signals from the Mitochondrial Information Processing System (MIPS) (Cell Metabolism 2022). That being said, one could certainly profile other organelles across the brain.
Can your work be correlated to mitochondrial brain work on neurodegenerative diseases, such as Parkinson’s or Alzheimer’s diseases?
Yes, this is a future direction some of our colleagues are interested in. But when we study diseased brains, it’s like trying to understand the causes of a car crash by looking at the totaled, permanently damaged vehicle. Without looking at the driver, we likely will never know why the vehicle/brain crashed in the first place. In the brain and living organisms, the driver is energy. And energy fluxes through our mitochondria.
You suggest that your method correlates with other imaging methods. Do you think these might have potential to eventually be used in diagnostic methods?
Yes, our hope is that we can quantify mitochondrial content and quality or health with standard neuroimaging methods. In the living human brain, non-invasively.
How did you come to be interested in mitochondria in the first place?
Mitochondria are the dynamic energetic portal between the physical processes that convert food and oxygen into subjective experiences, and consciousness. In graduate school, I became increasingly convinced that mitochondria were going to teach us something meaningful about mind-body processes. Now we study the mind-mitochondria connection, in and outside the brain.
References
1Mosharov EV, Rosenberg AM, Monzel AS, Osto CA, Stiles L, Rosoklija GB, Dwork AJ, Bindra S, Junker A, Zhang Y, Fujita M, Mariani MB, Bakalian M, Sulzer D, De Jager PL, Menon V, Shirihai OS, Mann JJ, Underwood M, Boldrini M, Thiebaut de Schotten M, Picard M (2025) A human brain map of mitochondrial respiratory capacity and diversity. Nature https://doi.org/10.1038/s41586-025-08740-6.
2Thiebaut de Schotten M, Picard M (2025) A map of mitochondrial biology reveals the energy
landscape of the human brain. Nature https://doi.org/10.1038/d41586-025-00872-z.
3Human MitoBrain Map (2025) Michel Thiebaut de Schotten. Retrieved from: http://humanmitobrainmap.bcblab.com/. April 1, 2025.
For more links and videos, visit http://humanmitobrainmap.bcblab.com/
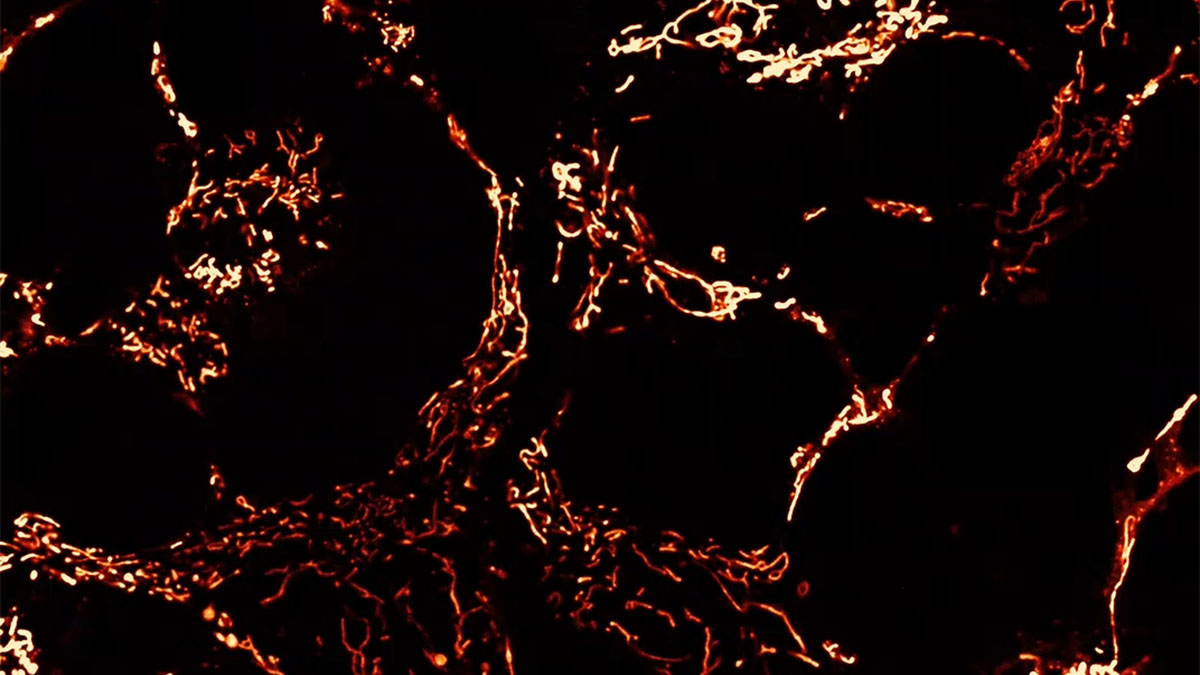
 Prediction of whole-brain mitochondrial density visualized along a red (high) yellow (low) gradient projected onto the lateral view of the brain. The map is overlaid on a tractographic representation of the brain, illustrating the connectional organization of white matter pathways.
 Prediction of whole-brain mitochondrial density visualized along a standard heat gradient projected onto an axial slice. Warmer colors (e.g., red/yellow) indicate higher predicted mitochondrial density, whereas cooler colors (e.g., green/blue) denote lower density. The map is overlaid on a tractographic representation of the brain, illustrating the connectional organization of white matter pathways.